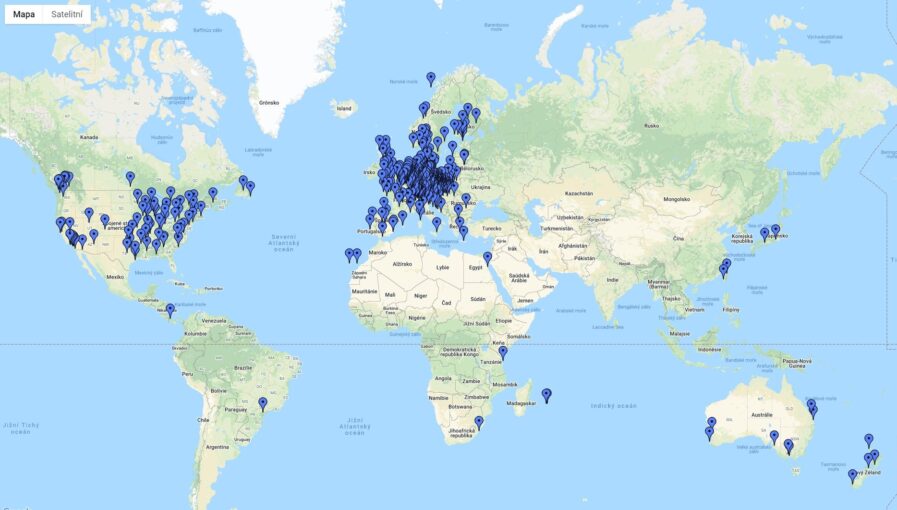
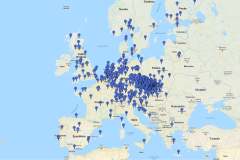
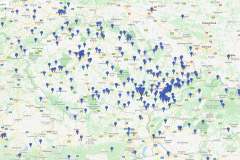
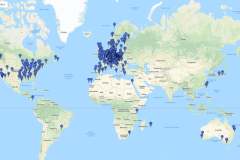
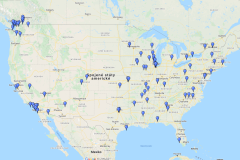
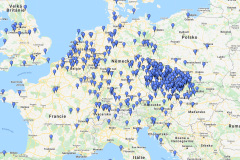
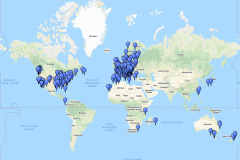
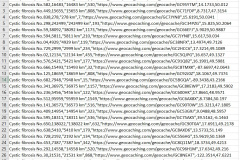
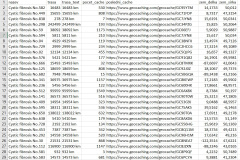
I will show you how to make a map with your travel bugs with with their current location for use in google maps . Second scripts makes 2 Excel file for My Maps use and second for statisctics of TBwith info about total travel, total visited geocaches and last visited geocache.
Scripts for processing: https://drive.google.com/file/d/1yFY9…
R download: https://cran.r-project.org/bin/window…
RStudio download: https://www.rstudio.com/products/rstu…
Instruction:
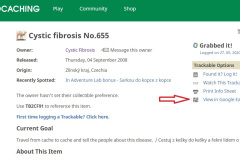
1. Download the attached file and unzip it anywhere on your computer. There you will find the script „Slouceni KML.R“ and then the folder „files“, in which you will put your individual KML files. This is probably the worst part (without automation) of the whole process so far. You have to manually download * .kml files of each subject, where you are interested in its position or other statistics. You will always find it as the last item in the right column of the TB – View in Google Earth listing Download a file from my google cloud, which you will then work with , which you will then unzip. The merged files will then be uploaded to this folder (just so you know where the output will go).
2. Download and install the R program. It is an open source console where scripts written in the R language are run. It is a program that is very often used in statistical analysis and data processing. Mainly in science.
3. The script could also be run directly via the console, but it is easier to install RStudio for free. So please download and install RStudio You only have to install RStudio after the R program itself to connect with it.
4. Now all you have to do is double-click the script „Slouceni-KML-version-1.3“ (it will already have a blue circle icon with „R“. The script will open in RSstudio Slouceni-KML-verze-1.3.R – this is the latest (most current) version for export to KML format for uploading to Google Earth Slouceni-CSV-pro-My-Maps-verze-1.1.R – this script creates a file in CSV format, which can be opened in Excel and contains the number of km driven, the number of caches visited, the link to the last cache and the current coordinates = last cache, where he was logged. And it also creates a CSV file for import into Google My Maps. There you can style the points in different ways and possibly share the map with someone via the link.
5. The program and four windows will appear in it. – in the upper left you will see the script – in the lower left are the outputs from the console R – in the upper right after startup you will see the loaded variables – in the lower right there are hints, graph outputs, etc.
6. To run the script, select the entire text in the upper left window (the script itself) and press Ctrl + Enter or click on the green „run“ arrow at the top
7. At the bottom left, you are running in the console of what’s happening. When this happens, it will end in processing time and you will have a new KML in your folder.
8. Note: The first time you run the script, it installs one „sf“ library and needs a net connection. Next time it will no longer install it and it will be faster 😉
